Posts

mcm daily market update 22.Jul.22

ST trend: neutral (with potential larger topping pattern)

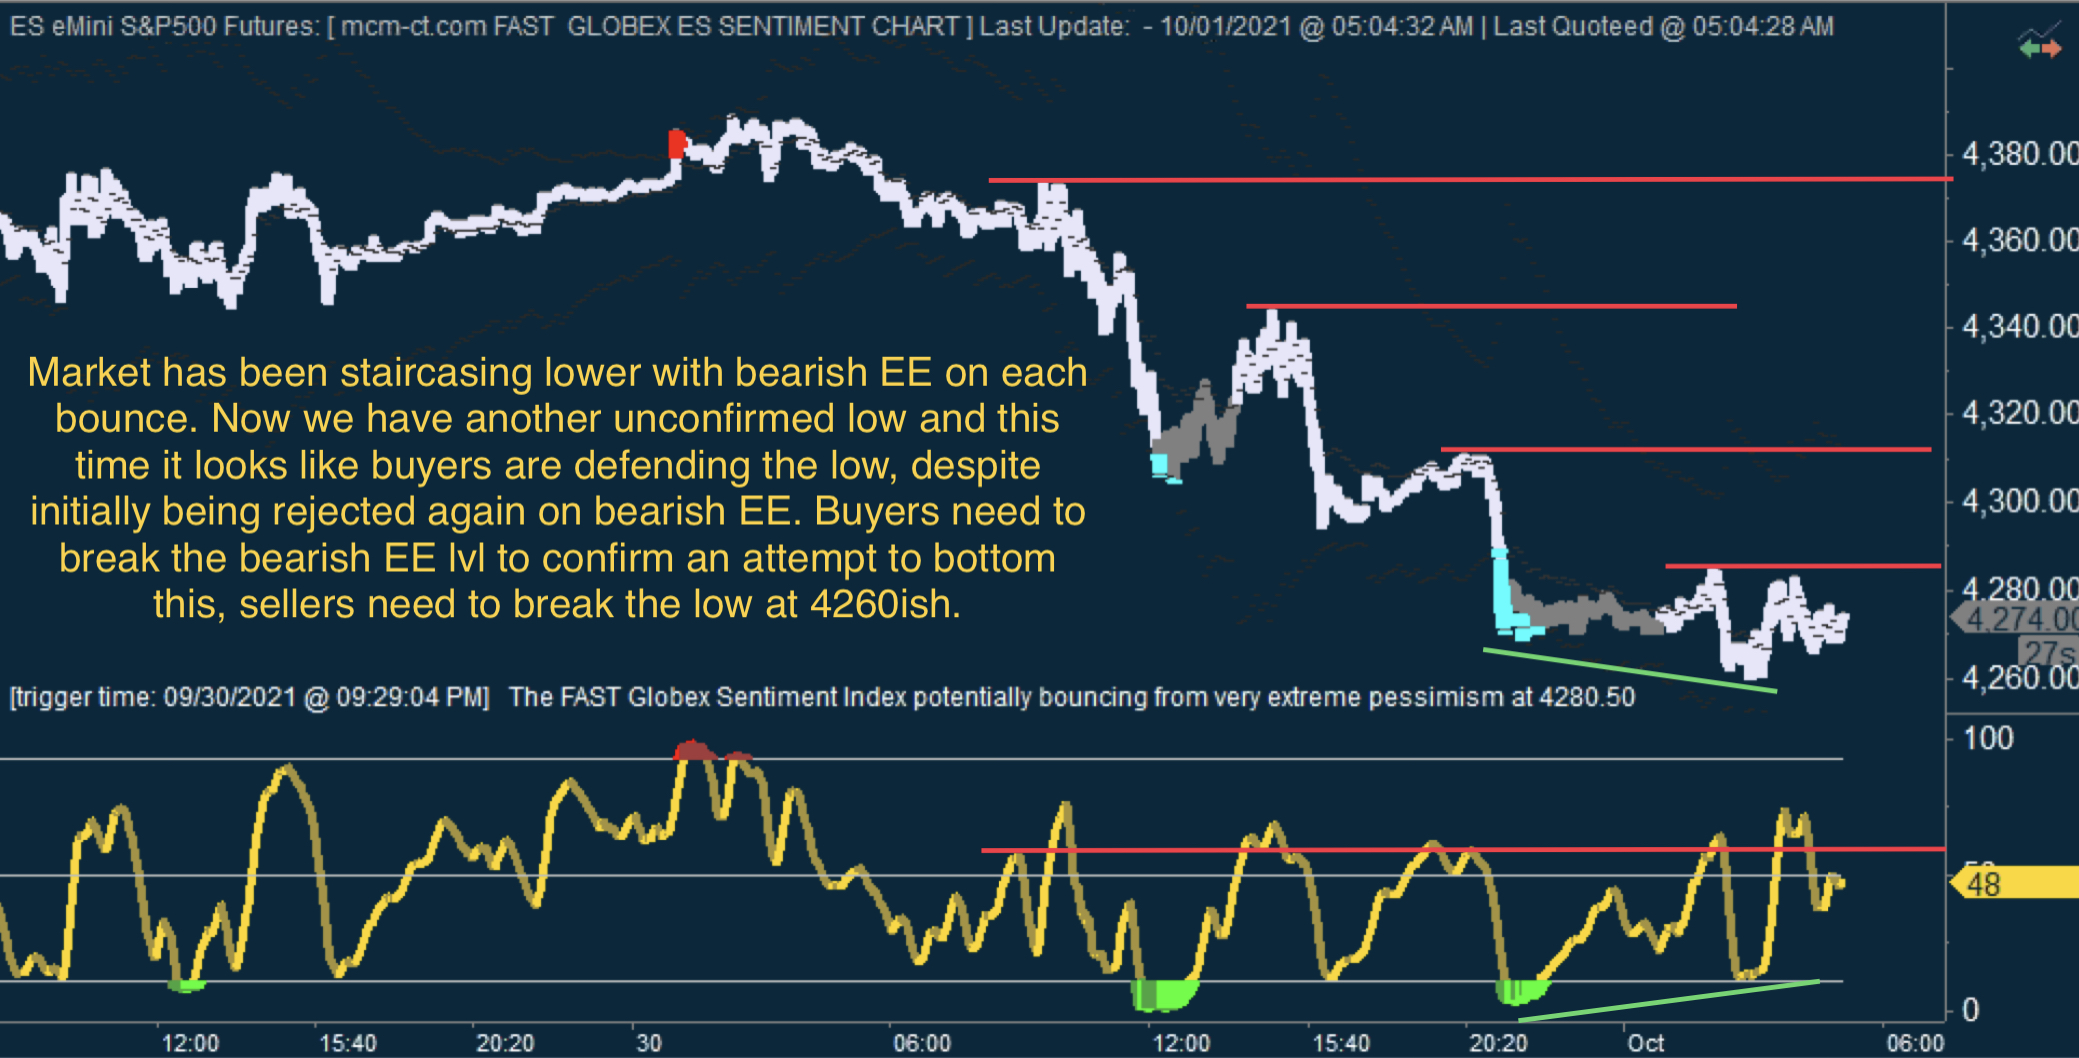
Yesterday we were noting that the ST trend was neutral, as buyers were inefficient via FGSI, having put in bearish EE vs the prior HOD, and price was testing ML once again. We did mention that ML was key for the trend and buyers managed to defend it initially bouncing to near the o/n high, but head-faked the breakout and droped below ML. That was a head-fake too, as it was then very quickly recovered and buyers pushed to new highs closing at the highs too.

The o/n saw us pullback from the new high and the pattern is a bit worrying for bulls. That squeeze high was unconfirmed on all 3 GSIs (FGSI, IGSI and MGSI). Additionally both FGSI and IGSI peaked at extreme optimism close to there. And both FGSI and IGSI have geo/fib ratios converging there. That means that yesterday's HOD is THE key level for bulls. They cannot affort to pause here, because if this pulls back it will look like a ST top from where a multi-day decline can start. ML is key, as always. As long as ML is defended, this can be just another "usual" pullback before running back higher. If yesterday's unconfirmed high is not reversed (i.e.bested and turned into a confirmed high) and ML is lost, then the larger topping pattern will be confirmed and bulls will want to be careful for a while.

EWT wise the wave counts align well with TTs. Yesterday's final push looked like an ending diagonal (ED). Which also makes that high the key overlap, just like shown by TTs. If ED, then the entire move off 3720 might be done and would need to be retraced at one of the usual Fibs (38,2%, 50% or 61,8%) before (potentially) resuming the up trend.

mcm daily market update 06.Jul.22

ST trend: neutral

The market threw in 2 "there and back again" moments as it took out Friday's high in the o/n session, only to give up all those gains and test last week's lows during the RTH session. There buyers found their footing again and rallied right back up to the highs again.

The o/n did little to resolve the situation as we had the usual push to minor new highs, then consolidation back to ML. So far ML is holding, but buyers are unable to move significantly past the highs. FGSI is also showing large swings both ways, so for now it seems the near term trend is up for grabs. ML and macro-ML are the main area and line in the sand. If these are lost, then sellers would take the lead and quite possibly take us lower than last week's lows. If ML and macro-ML are defended, then buyers could start to squeeze higher. Binary outcome so far.

In terms of the big picture, the EWT options also look binary. Either we are already in wave 3/C going (buyers would need to continue higher directly for that), or we just finished a complex correction wave b of 2/B and we should head lower in a minor c wave (or larger 2/B). Target for this would be 3700ish, so buyers need to step in here to avoid that.

Also a note on the new additions to FGSI and IGSI charts. Fib and geometric ratios have been added to these price charts and as can be seen they work quite well. Risk management is paramount for these though, so if playing the convergence of lvls, stops below that lvl are a must. They caught all significant highs/lows so far, so when they trigger it's definitely worth paying attention to.

mcm daily market update 25.Apr.22

ST trend: down (with bottoming attempt)

On Friday we were noting that the ST trend was down with potential bottoming attempt, as we had the potential for a bottom with FGSI and IGSI showing unconfirmed lows. We warned that "The absolute KEY level for buyers to defend is the o/n low. Below that likely opens up the flood gates again and we could see a repeat of yesterday". Our warning came true, after losing the o/n low, there was no looking back as the flood gates opened again and same type of action as the prior day happened - non-stop selling with little bounce along the way.

Sunday opened even lower (as expected and called out in the chat room on Friday) and we dropped another 40+ points from Friday's close. The o/n today continued even lower. Now we again have the potential for a bottom, as IGSI is not confirming these lows. Price made a double bottom at the o/n low and buyers defended it, staging a bounce, however FGSI is showing buyers are inefficient on this bounce, which is capped by the 400bar MA so far. It looks like we have the same situation as Friday. If the o/n low is broken, then it's possible we will get yet another leg down, similar to Thursday and Friday. If buyers can defend, then we might see a larger bounce, maybe to test ML. Ultimately, it looks like the market has a date with the mid March lows, so the expectation would be for us to see that area before this series of declines stops (at least for a while).

mcm daily market update 25.Feb.22

ST trend: neutral

Yesterday we were mentioning that the ST trend was down with potential bottoming attempt. At the time we were testing the unconfirmed low on FGSI and it looked like the final low wasn't in yet. But buyers held that low (narrowly) and after the RTH open never looked back. We had a huge up day and TTs showed us that the mkt character changed, as danny held as support all day. Buyers had a huge win reversing the entire large gap, winning back ML and actually ending the day very green. Price finally stopped at the macro-ML test.

The o/n saw the expected pullback to ML, as the mkt was very extended immediate term (FGSI at extreme optimism and sell zones on its chart). Buyers held ML so far, which is constructive for higher prices. For today the situation is pretty straight forward. As long as buyers hold ML, they could continue to push higher immediately. If ML is lost, then a deeper pullback is possible. Buyers do not want to see this heading much lower than 4200, with 4150 being the MUST defend lvl (bullish EE on FGSI vs that level).

mcm daily market update 24.Jan.21

ST trend: down

On Friday we were noting that the ST trend was down, as the market continued to act weak. We also warned that "Large bounces are possible, but are likely to be good selling opportunities, while attempting to buy dips is extra risky. Dust should settle after OPEX, so the timing window for a potential important low would be Monday or Tuesday". That proved to be the case, as the large bounce off the RTH open back-tested ML and was rejected there strongly. Market then fell almost 100 points from that ML test to close near the lows.

On Sunday, buyers managed to step in and push price a bit higher, but then hit a brick wall near 4425 and stopped. Today's o/n action pushed once again in that 4425 lvl and got rejected and proceeded to break Friday's low. We are now in the timing window we considered for a low - today or tomorrow. While it does no seem the low is in yet, another large drop today could reach capitulation on the buyer side and then see a strong bounce. FGSI shows a confirmed low on the last low, so that will likely be taken out before an important bottom is found. We also have FOMC this week and Powel speaking on Wednesday, after the FOMC announcement. That could be a potential catalyst for another trendy move. So for now the ST trend (as well as the main trend) is down. Play accordingly until the market shows us a change in that character.

mcm daily market update 12.Nov.21

ST trend: neutral

Yesterday we were noting that the ST trend was up, as sellers continued to be inefficient on pullbacks, while buyers had managed to win back ML. We did mention that ML is the key for the trend and that proved to be important. ML was lost early after the cash session started, which was a warning buyers are losing control. Sellers were not able to take advantage of that though and we spent the rest of the day in a sideways chop.

The o/n didn't bring much change. Both sides are inefficient (via FGSI) and we continue to chop sideways, just like in yesterday's cash session. ML is still overhead and rejected price several times - again, just like yesterday. ML continues to be the key level and if buyers manage to win it back, that breakout would be significant. The breakout must be sustained, a head-fake above ML which fades back below would actually be very bearish. So keep an eye on ML and how price acts around it. Given the sideways chop yesterday, today should bring a bigger move. ML should tell us if it will be up or down.

mcm daily market update 1.Oct.21

ST trend: down (with potential bottoming attempt)

Yesterday we were mentioning that the ST trend was neutral, as both sides were showing inefficiency via FGSI. We did note however that after buyers had won ML in the o/n, the decline off extreme optimism on FGSI saw ML being lost again. That was a warning the trend shift (back to up) was not confirming. The cash open saw ML being tested from below again, but it held as a brick wall and we got a big down day. The bounce attempt from noon was sold off hard into the close and cash session closed at the lows again.

This time however it seems the weak cash close was no longer a bear trap. The bounce off the weak close was VERY weak, and FGSI kept showing that buyers were inefficient on each bounce attempt. And each one was then sold off to new lows. Which brings us to the current set-up. The trend is clearly down, however we do have the potential in place for a bigger bottom. The last low was unconfirmed on both FGSI and IGSI. And even though the initial bounce off there generated yet another bearish EE which held, this time sellers couldn't push price to a new low. 1st step for buyers to do to confirm the attempted bottom would be to break the bearish EE level. After that the all-important ML test will likely be the next big inflection. As long as ML is overhead, the main trend is down, so no big bounce can come until that is won back. Below the unconfirmed low would break the attempted bottom and continue the pattern of lower lows.

mcm daily market update 5.Mar.21

ST trend: neutral (with bearish risk)

It seems the market stopped tipping its hand in the o/n session and keeps things in suspense until the cash market open. For several days we were noting that the trend was neutral as both sides were showing inefficiency via FGSI in the o/n session. Yesterday the buyers staged an attack over ML to get us back to an uptrend, but failed just above as the markets were disappointed by Powel's remarks. Funny how that works. So just to mention this again: ML is a KEY level for the overall trend. If price is above, we have a bullish bias, while if price is below - bearish.

In the o/n, both buyers and sellers were inefficient, as the market still tries to digest the mini-crash off Powel's statements. We have bearish EE above which held price action and pushed it lower and now bullish EE set up with FGSI bouncing from extreme pessimism. Those levels remain important and a breach would mean one side is getting the upper hand. Buyers want to hold the bullish EE and ideally to break back above ML. That would help them and could trigger a "relief rally". Sellers want to make a stand at (or below) ML and try to attack yesterday's LOD. Breaking the bullish EE level would help them significantly.

Pages

e-Tick Tools

e-Tick Tools

Get Inside The Market

e-Tick Tools is a proprietary approach and technology that enables an unprecedented and in-depth analysis of exhaustive and emotional behavior in key markets. e-Tick Tools is fundamentally different from other analysis. It is not designed to analyze a series of prices, but rather analyze market facts, behavior, and events. The toolset represents its detailed analysis of key prices and confirmation feedback at key event-driven areas of significance. The results are unparalleled and enlightening: The methodology generates relatively few signals/data points but highly relevant and revealing real-time feedback.

e-Tick Tools Livestream gives you access to real-time charts and signals with spoken alerts from your PC, Mac, Linux, iOS, or Android.

e-Tick Tools Notifications delivers text alerts via the mcm Proprietary App to your mobile phone and or email.

Access from your PC, Mac, Linux, iOS or Android

e-Tick Tools provides a unique edge to view and interpret the markets, and is accessible so individual traders/firms can flexibly load it on multiple platforms.

Tick Tools and its supporting applications are formidable tools calculated on our servers - the tools require significant server resources for real-time calculation - this requires databases to be maintained, referenced and updated on an ongoing real-time basis to function correctly.

This is why we implemented a web distribution mechanism and maintain the data & the supporting databases, feeds, upgrades, and hardware requirements behind the scenes to that all these analytics can still accessed even on an iPhone or on your laptop/trading workstation.

Home

Home