Posts

mcm daily market update 03.Jan.22

ST trend: up (with pullback in progress)

First off: Happy New Year! Welcome to 2022!

On Friday we were mentioning that the ST trend was down, with potential bottoming attempt. The market had finally broken the 4770 support and fell to macro-ML quickly after that (as warned it would happen if ML and 4770 would give way). Price was just retesting 4770 and our expectation was that it could be just a reflective bounce. The market proved our expectations correct as it failed on the 1st back-test of ML and that important area and fell into another macro-ML test. Then another bounce, a spike above ML to 4780, then again failure and sell-off to macro-ML. Basically the entire Friday session was a chop between 4780 and macro-ML. Buyers held macro-ML, so that at least gives them some hope of holding the up trend.

The New Year brought some support for buyers as we gapped up on Sunday above ML and buyers were able to hold it on the back-test. Then they made another high above 4780, although they stopped 10 points higher. Now we are seeing a pullback from extreme optimism on FGSI into yet another ML back-test. The fact that buyers held macro-ML and won back ML, gives them hope that they just might stick save the up trend and resume the move higher. They are definitely not out of the woods just yet, so they need to keep holding these important levels and push higher to avoid a longer (and deeper) consolidation. They have not shown too much efficiency on FGSI or IGSI, so there are still some issues. Nevertheless, as long as ML and macro-ML are below price, buyers have the edge, so that needs to be respected until those levels fail.

mcm daily market update 29.Nov.21

ST trend: neutral

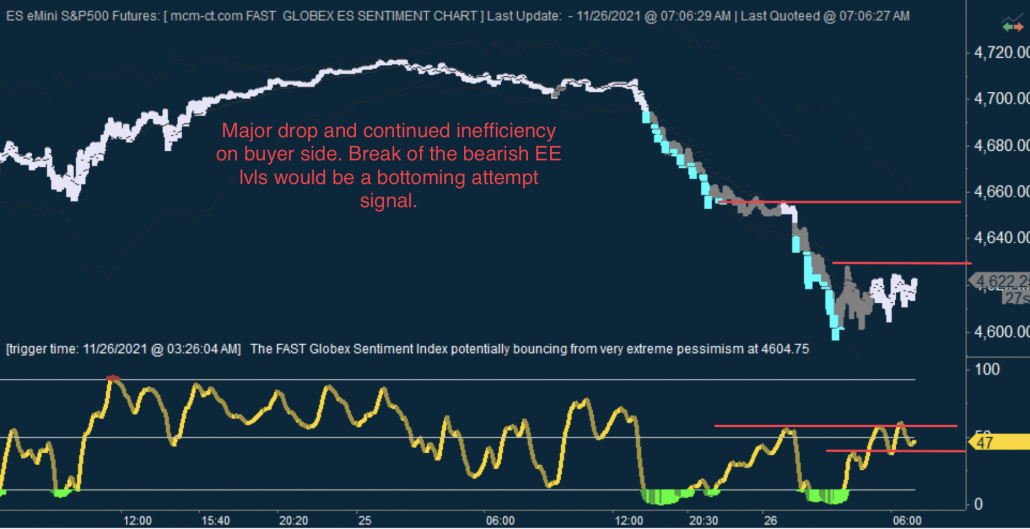
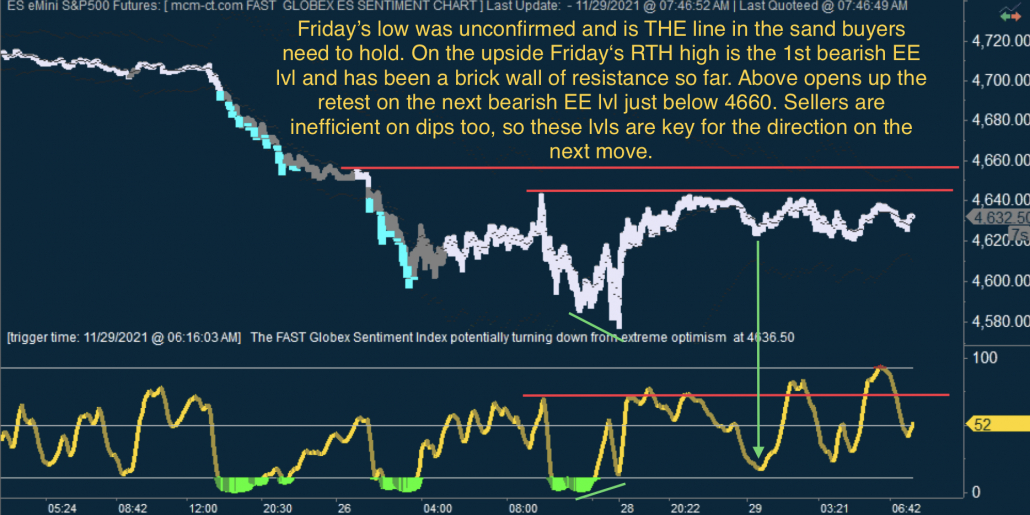
On Friday we were noting that the ST trend was down, with a potential bottoming attempt. The market obliged and buyers made a decent effort going into the RTH open, but failed to take out the important bearish EE level on FGSI just below 4660. That failure was pretty ugly and led to another 50+ points drop until the close.

Sunday saw a big bounce off that close at the lows as the news driven scare from Friday aleviated somewhat and the market got right back to Friday's bounce high (near 4640). Buyers couldn't push through and today we retested that area twice and rejected every time. What is more problematic is the fact that buyers have exhibited continued inefficiency on the bounces into that area, last bounce making a lower high in price, but a higher high in FGSI, hitting extreme optimism zone. Sellers are also inefficient on dips, which makes the near term trend neutral. When a bigger trend change happens it is normal to see initial indecision on FGSI with both sides being inefficient, so this could still be part of the bottoming process. For that to happen buyers would need to break through 4640 area soon (ML is also in its vicinity now) and then 4660. If they can take out those 2 levels, Friday's low would start to look like an important bottom. On the other side, sellers need to hold 4640 (ideally) and break Friday's low. That was unconfirmed on both FGSI and IGSI, so it is VERY important.

mcm daily market update 26.Nov.21

ST trend: down (with potential bottoming attempt)

On Wednesday we were mentioning that the ST trend was neutral as both sides were inefficient via FGSI and set up both bullish and bearish EE. Those levels were mentioned as important for breakout/down. The market dropped on the RTH to test the bullish EE level and held it narrowly, proceeding afterwards into a big bounce that took out the bearish EE level. They definitely won the battle when they held the bearish EE level.

Yesterday saw buyer euphoria continue as the market ramped another 20 points above Wednesday's high. It then started dripping lower very slowly before it picked up speed and outright crashed. From top to bottom we travelled more than 120 points. We do have now a potential bottoming zone. For the 1st time since this big decline started buyers have been building higher lows, despite bearish EE showing up on FGSI. And they have also started to whipsaw danny, which has kept a lid on bounces since near 4700. Buyers are not out of the woods yet, as they have been unable to hold above danny, while FGSI still has bearish EE vs a level that is almost 40 points higher. Nevertheless the fact that danny is no longer capping price is a 1st warning buyers are attempting to bounce back. If they can win back also 400bar MA, then that would be additional confirmation of a bigger low in the works. Buyers need to start holding danny as support in order to avoid a potential run to a lower low.

mcm daily market update 23.Aug.21

ST trend: up

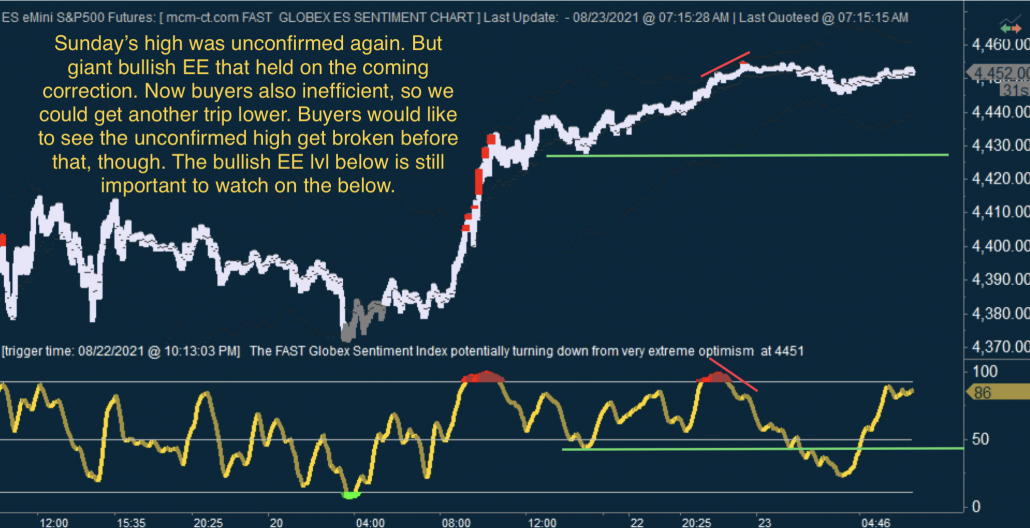
On Friday we were noting that the ST trend was neutral as in the o/n (ES was at 4385 at the time), both sides were looking inefficient via FGSI. We did warn however that "A sustained move above ML would reassure that the bottoming attempt from yesterday is playing out and the "OPEX scare" is over". Buyers did exactly that, broke the bearish EE lvl, won back ML and never looked back. We did not expect a large move considering the OPEX Friday, but apparently MMs were satisfied to keep just the big names (AMZN, AAPL) in check and the index ran regardless.

Sunday brought more bullish developments, as buyers continued the up move and broke the unconfirmed high that was registered on Friday on FGSI. They also broke the initial bearish EE lvl set-up on IGSI on the 1st bounce off the big low from last week. The only issues for buyers are the fact that the recent high is unconfirmed on both FGSI and IGSI; and FGSI is showing buyers are also inefficient on this bounce. Those things can still change if buyers continue higher, so they still look to be in decent shape. Ideally they would break the unconfirmed highs before getting a retrace to "cool off" FGSI and IGSI. Depending on whether they can do that or not, we will have more info. A ML test from here would be normal (especially since ML was pulled up by price and is likely not far below). The test should hold if this is to continue immediately higher. If ML breaks, then a deeper retrace could come, but in the larger picture it's hard to see how sellers can avoid new ATHs coming.

mcm daily market update 16.Aug.21

ST trend: down

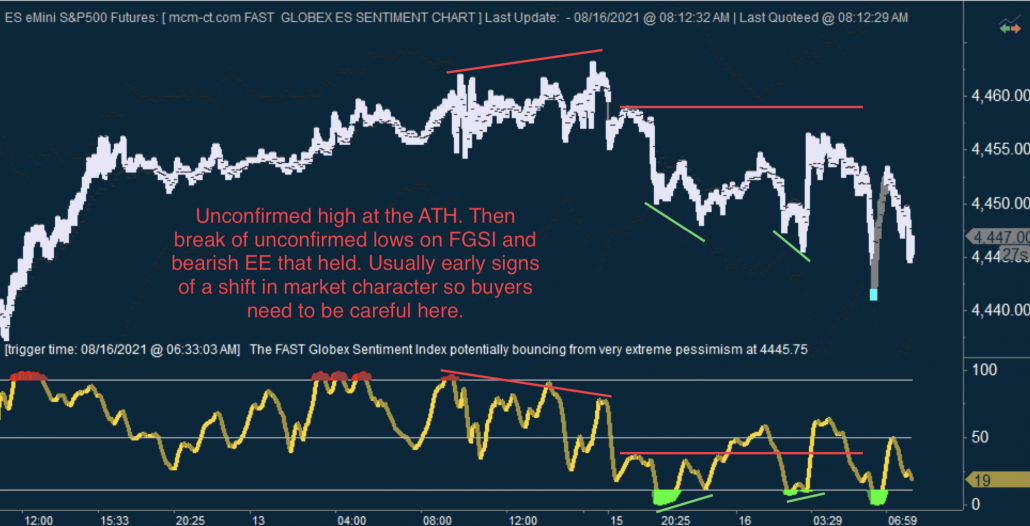
On Friday we were mentioning that the ST trend was up, with potential pullback set-up, as FGSI was at extreme optimism. The pullback was small, then the market pushed to new highs in a very choppy session. It also made a new ATH after hours. The Sunday session saw a pullback from there (the ATH was marked as unconfirmed high on FGSI).

The current o/n saw continuing weakness and what is interesting is that for the first time in a while, the buyers were not able to lift prices back to new highs out of FGSI trips to extreme pessimism. What is more worrying for the buyer side is the fact that 2 unconfirmed lows on FGSI were subsequently broken. That usually marks a shift in market character (i.e.to something more bearish in our case), so it's a big warning that buyers are no longer in full control. ML was also broken by price and now appears to be holding as resistance. That also confirms a more bearish ST picture. Going fwd, it is important to see how price acts in relation to danny and ML. For buyers to get back in control, they must break back above ML. if they can do that, this might be another failed breakdown from seller side. However if ML continues to act as resistance and price continues lower, this might be the 1st trend down day we had in a while. This week is OPEX so shake-outs in both directions are to be expected. Considering that markets are so extended, a bigger pullback would not be out of the question (1st target 4408-4415 - large fractals on 60 and 135min cycles. Below that - 2nd target is 4370-4380 and the bottom of the prior trading range).

Lessons learned part 4

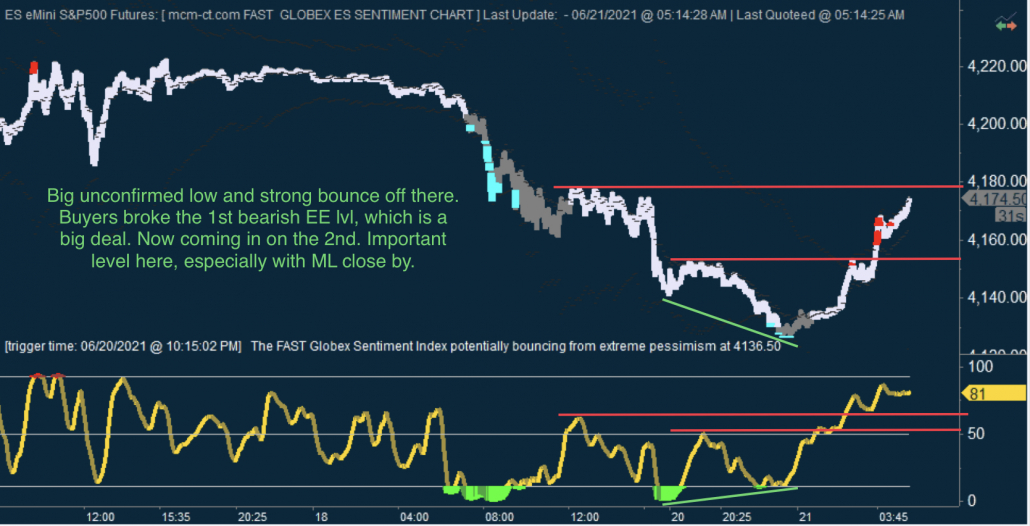
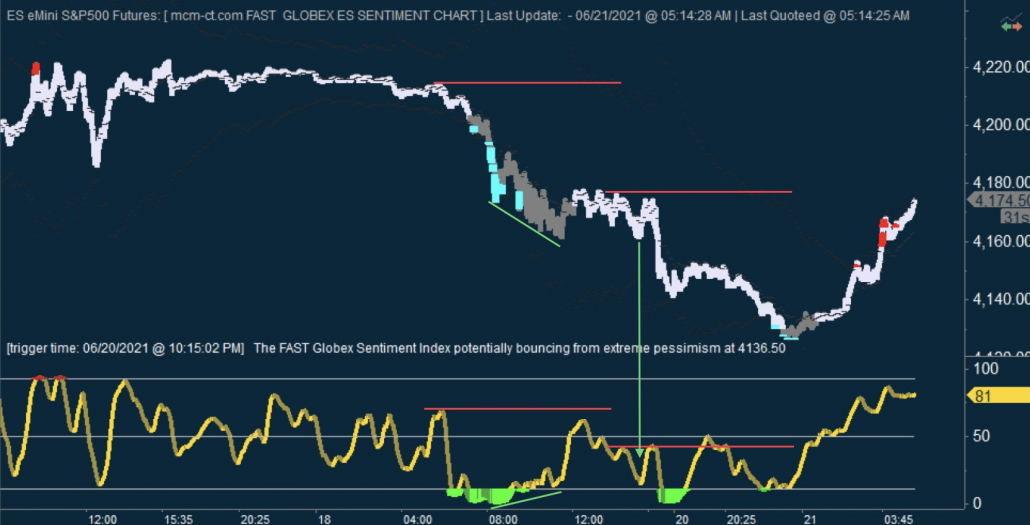
The past week (21-25th of June) we had a very strong week and a powerful melt-up off Sunday's OPEX lows. Those lows were announced on Monday in the am on the daily blog post with the mention "This set up has the potential to mark an important bottom and trigger an explosive bounce". That came to pass and the market relentlessly pushed higher, with only small pullbacks. Because the short term GSIs (Globex Sentiment Indexes) caught that potential, it is time to look more closely at these kinds of set-ups and see what provides confirmation or non-confirmation.

First, let's look at FGSI, which because it's the fastest will usually trigger the set-up first and will also be the 1st one to confirm. The chart below was the one posted on the blog on Monday, June 21st. As we can see we had a large unconfirmed low, the market rallied right into a bearish EE (excess energy) level, hesitated briefly, then broke through it. That was the confirmation that the unconfirmed low would hold and it is a bullish breakout from there (roughly 4154ish).

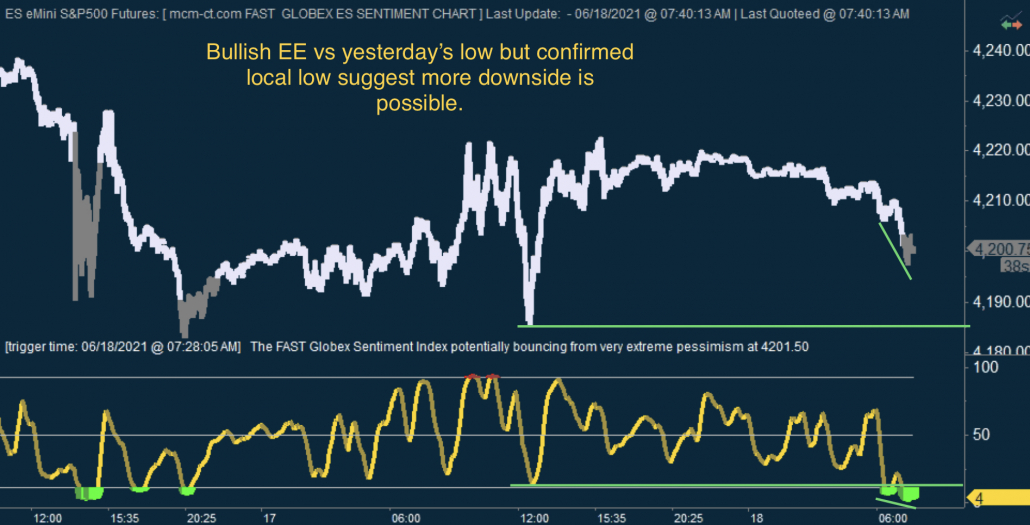
Now let's have a closer look at an earlier set-up of an unconfirmed low, which failed, namely the Friday morning low. We had a pretty large unconfirmed low (although the set up was not as ideal as the one from Sunday, as the lows were too close to each other, not to mention the IGSI and MGSI set-ups). And then the ensuing bounce was showing that buyers are inefficient, as price barely bounced 20 points off the lows, but FGSI was already above the centerline and triggered a very large class B bearish EE vs the last time FGSI was in that area. Price then whipsawed from that area back towards the unconfirmed low where buyers made another attempt to stick save that low (where the green arrow points). The bounce triggered a bearish EE which held and then the breakdown happened.

So the main lesson here is - whenever we have an unconfirmed low (or high), that shows the potential for a larger turn. But the key to that potential playing out is how price acts when we have an EE set-up after that. Breakout/down of that EE set up is the confirmation that a larger turn is playing out.

mcm daily market update 18.Jun.21

ST trend: down, with potential bounce attempt

Yesterday we were noting that the ST trend was neutral as both sides were inefficient, as shown by FGSI (something which is happening quite often in the o/n as of late). The market had a big pop prior to the open, then a few whipsaws before finally dropping hard to retest Wednesday's lows before rallying hard into the close and retest the highs of the day.

The o/n now saw the market moving sideways and then starting to drift lower. FGSI is showing extreme pessimism already, so a bounce might be attempted, but it it also showing confirmed local lows, so the decline might extend. We have a bullish EE lvl vs yesterday's LOD, so that levels becomes important if we do in fact accelerate lower. The biggest problem for buyers is the fact that they lost ML, then tried to win it back but failed.

mcm daily market update 16.Jun.21

ST trend: neutral

Yesterday we were noting that the trend was up, but with a potential reversal pattern, as all GSIs were showing unconfirmed highs at the o/n high. That did prove to be a bad omen for buyers and the market proceeded to then retrace the entire rocket launch move from Monday's last 2 hours cash session.

At LOD we did get an unconfirmed low on FGSI and market tried to bounce, but this time the bounce failed to get above ML, which is a clear indication that the buyers are losing control of the ST trend.

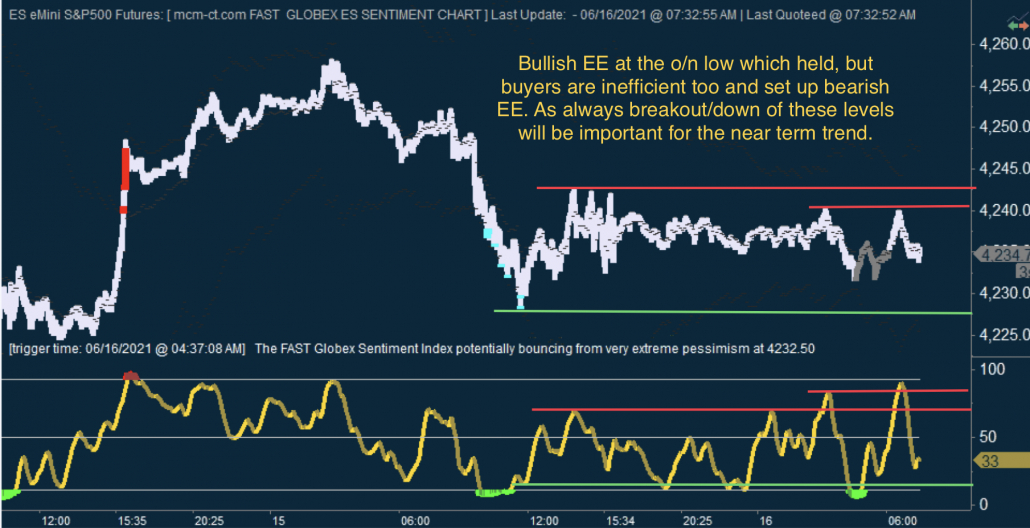
In the o/n session we had only a sideways movement with whipsaws in a tight range. FGSI is showing that both buyers and sellers are inefficient, as small price movements trigger big swings in FGSI. One thing that gives the sellers an edge is ML and the fact that it rejected price action yesterday but also in the o/n. ML continues to be the key for the near term trend, so if buyers want to stage a bigger bounce from here they must break above ML. Today is the conculsion of the FED 2 day meeting, so prices might stall and continue to sideways chop from the o/n until after the FED announcement and then stage a larger move.

Pages

e-Tick Tools

e-Tick Tools

Get Inside The Market

e-Tick Tools is a proprietary approach and technology that enables an unprecedented and in-depth analysis of exhaustive and emotional behavior in key markets. e-Tick Tools is fundamentally different from other analysis. It is not designed to analyze a series of prices, but rather analyze market facts, behavior, and events. The toolset represents its detailed analysis of key prices and confirmation feedback at key event-driven areas of significance. The results are unparalleled and enlightening: The methodology generates relatively few signals/data points but highly relevant and revealing real-time feedback.

e-Tick Tools Livestream gives you access to real-time charts and signals with spoken alerts from your PC, Mac, Linux, iOS, or Android.

e-Tick Tools Notifications delivers text alerts via the mcm Proprietary App to your mobile phone and or email.

Access from your PC, Mac, Linux, iOS or Android

e-Tick Tools provides a unique edge to view and interpret the markets, and is accessible so individual traders/firms can flexibly load it on multiple platforms.

Tick Tools and its supporting applications are formidable tools calculated on our servers - the tools require significant server resources for real-time calculation - this requires databases to be maintained, referenced and updated on an ongoing real-time basis to function correctly.

This is why we implemented a web distribution mechanism and maintain the data & the supporting databases, feeds, upgrades, and hardware requirements behind the scenes to that all these analytics can still accessed even on an iPhone or on your laptop/trading workstation.