
Lessons Learned part 2
Last week we had one of my favorite low risk set-ups, namely the Maginot Line (ML) "return to mean" trade. Actually it is a return to ML trade, but it works like a return to mean. This set-up basically states that whenever price gets too far (meaning more than 30-40 points) from ML, either on the upside or the downside, it is likely that it will go back to touch ML in the near future (1-2 trading days, but usually it's in the very next one). Because of the 1 and 2.5min cycles, this set-up can be entered into very close to the actual peak and can be turned into a stress-free trade very quickly. Also worth mentioning is that more often than not, ML will overshoot in the other side once price comes to it, so some runners can be left for that instance.
But let's see the real example from last week, which was text-book.
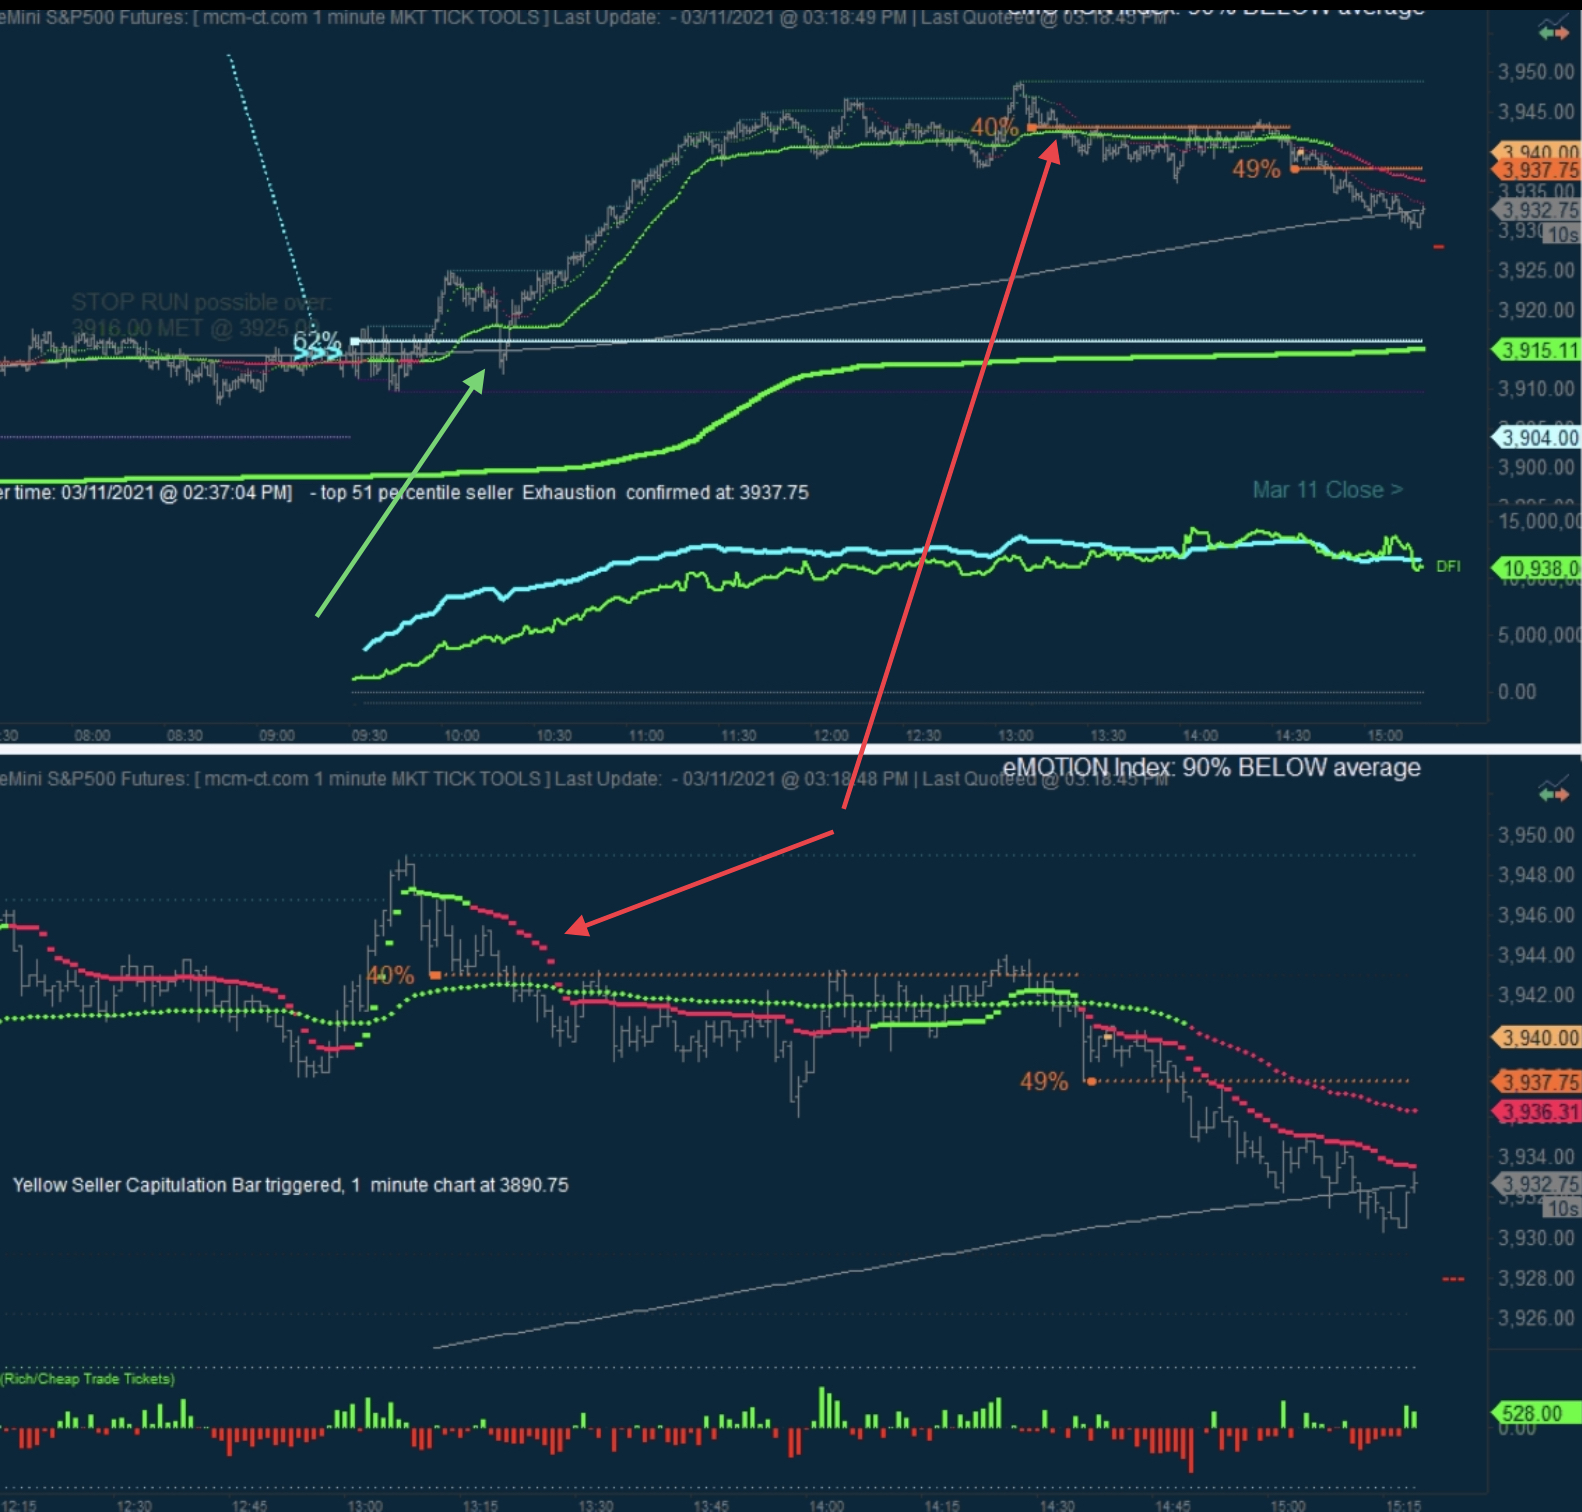
First off, Tick Tools (TT). As can be seen on the chart, we had a breakout above a buyer exhaustion right off the cash session open and after that bulls were fully in control until they reached the 3945-3950 area. Up there, they were already close to 40 points above ML (which is trending up when price is moving up, so that's something to consider when putting profit targets). The turn was anticipated by the "rounded top" pattern, which is price action stopping after a steep ramp and unable to breakout of a certain level, despite several tries. But it was the break of the 1st seller exhaustion (SE) and then this lvl turning into resistance that was the clear signal that buyers were losing control.
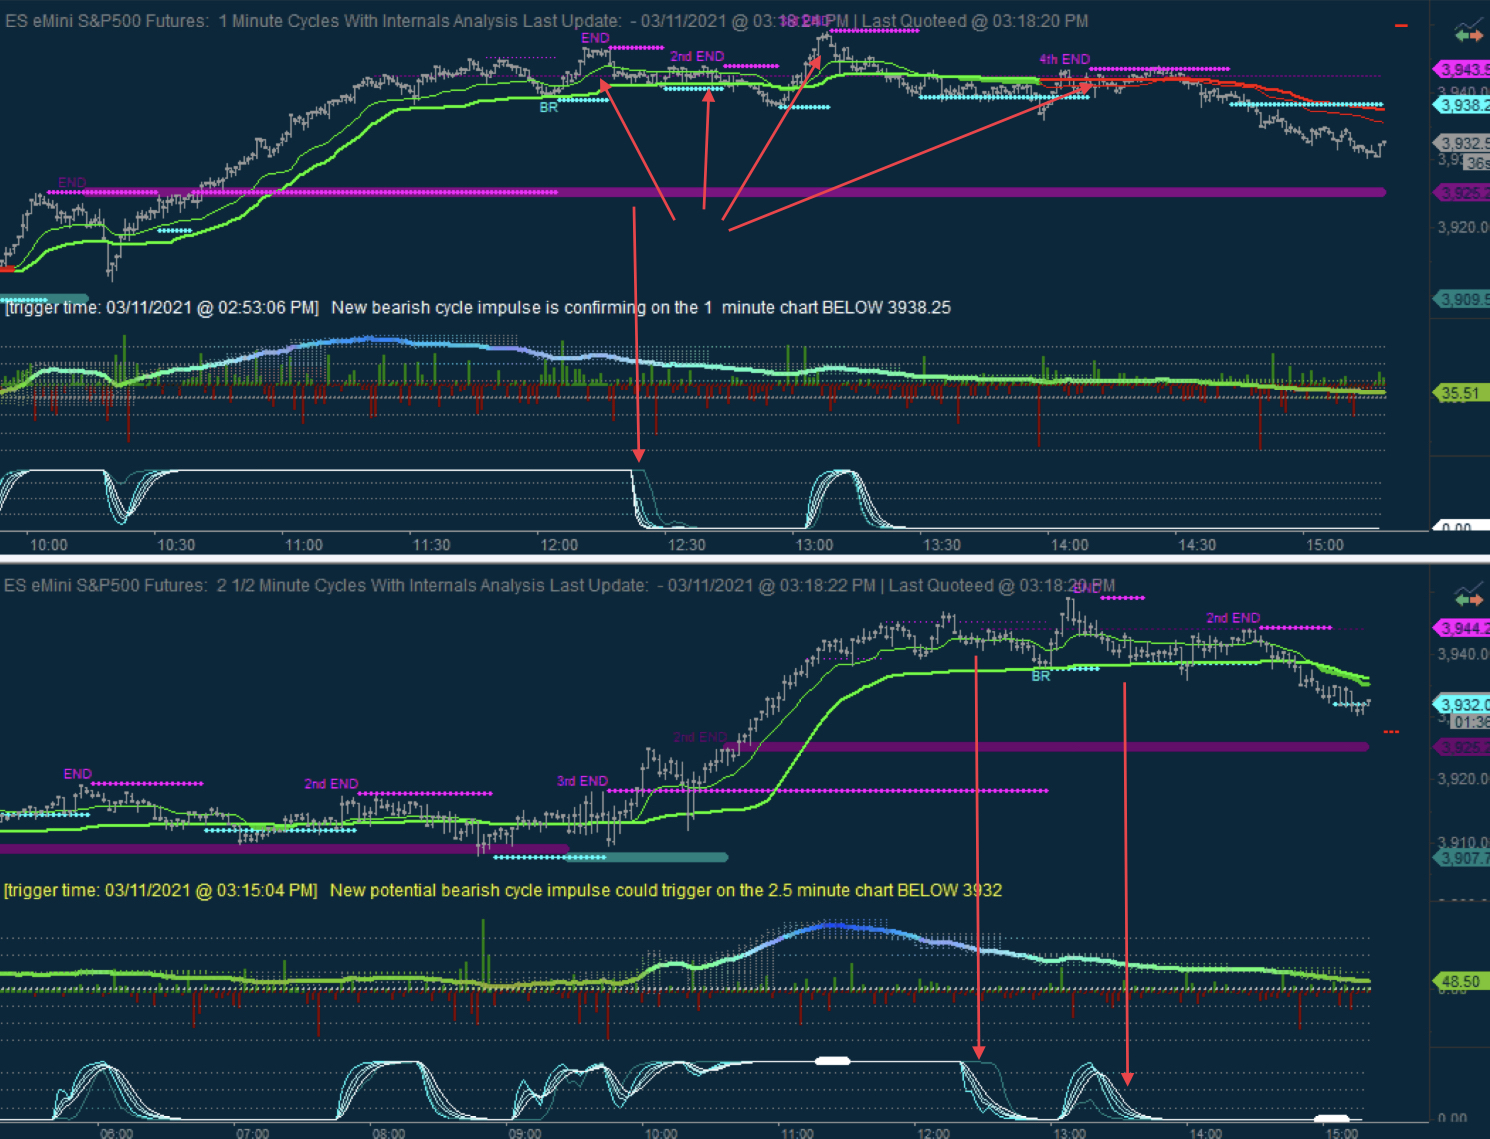
1 and 2.5min cycles were amazing at pin-pointing the turn and giving several entry possibilities, as they were unwinding the up impulses. 1min being the fastest, unwinds first and had a total of 4 END resistances painting, while 2.5min only had 2. Additionally, both had their cycle strength tool (white line at bottom of the chart) turn lower from max value. That is a great tool at pointing the turn after a huge run (both up or down) and you can see it went down pretty early once the up move lost momentum, giving plenty of warning and preparation time for setting up the short entries. A 3rd clue about the turn was the cycle oscillator tool (green line between the price chart and the cycle strength tool) which had a big divergence at the nominal high. It peaked at very high value (where the line actually became blue/cyan), and then come back down, even if price made new highs after that. The cycle oscillator tool never confirmed those highs.
When this type of set up presents itself, the best way to play it is to start shorting the END resistances on 1min (if more aggressive) or on 2.5min (if more conservative), AFTER the cycle strength tool moves down. As can be seen, 1min provided 3 entries (had 4 ENDs unwinds, but the 1st one was before the cycle strength tool moved), while 2.5min provided 2 entries.
FGSI and IGSI completed the picture, showing this short was a low risk trade. Both were at extreme optimism (red zone) and FGSI was putting in strongly unconfirmed highs. Because of this, the likelyhood that the market could have continued higher directly, without a pullback was low odds.
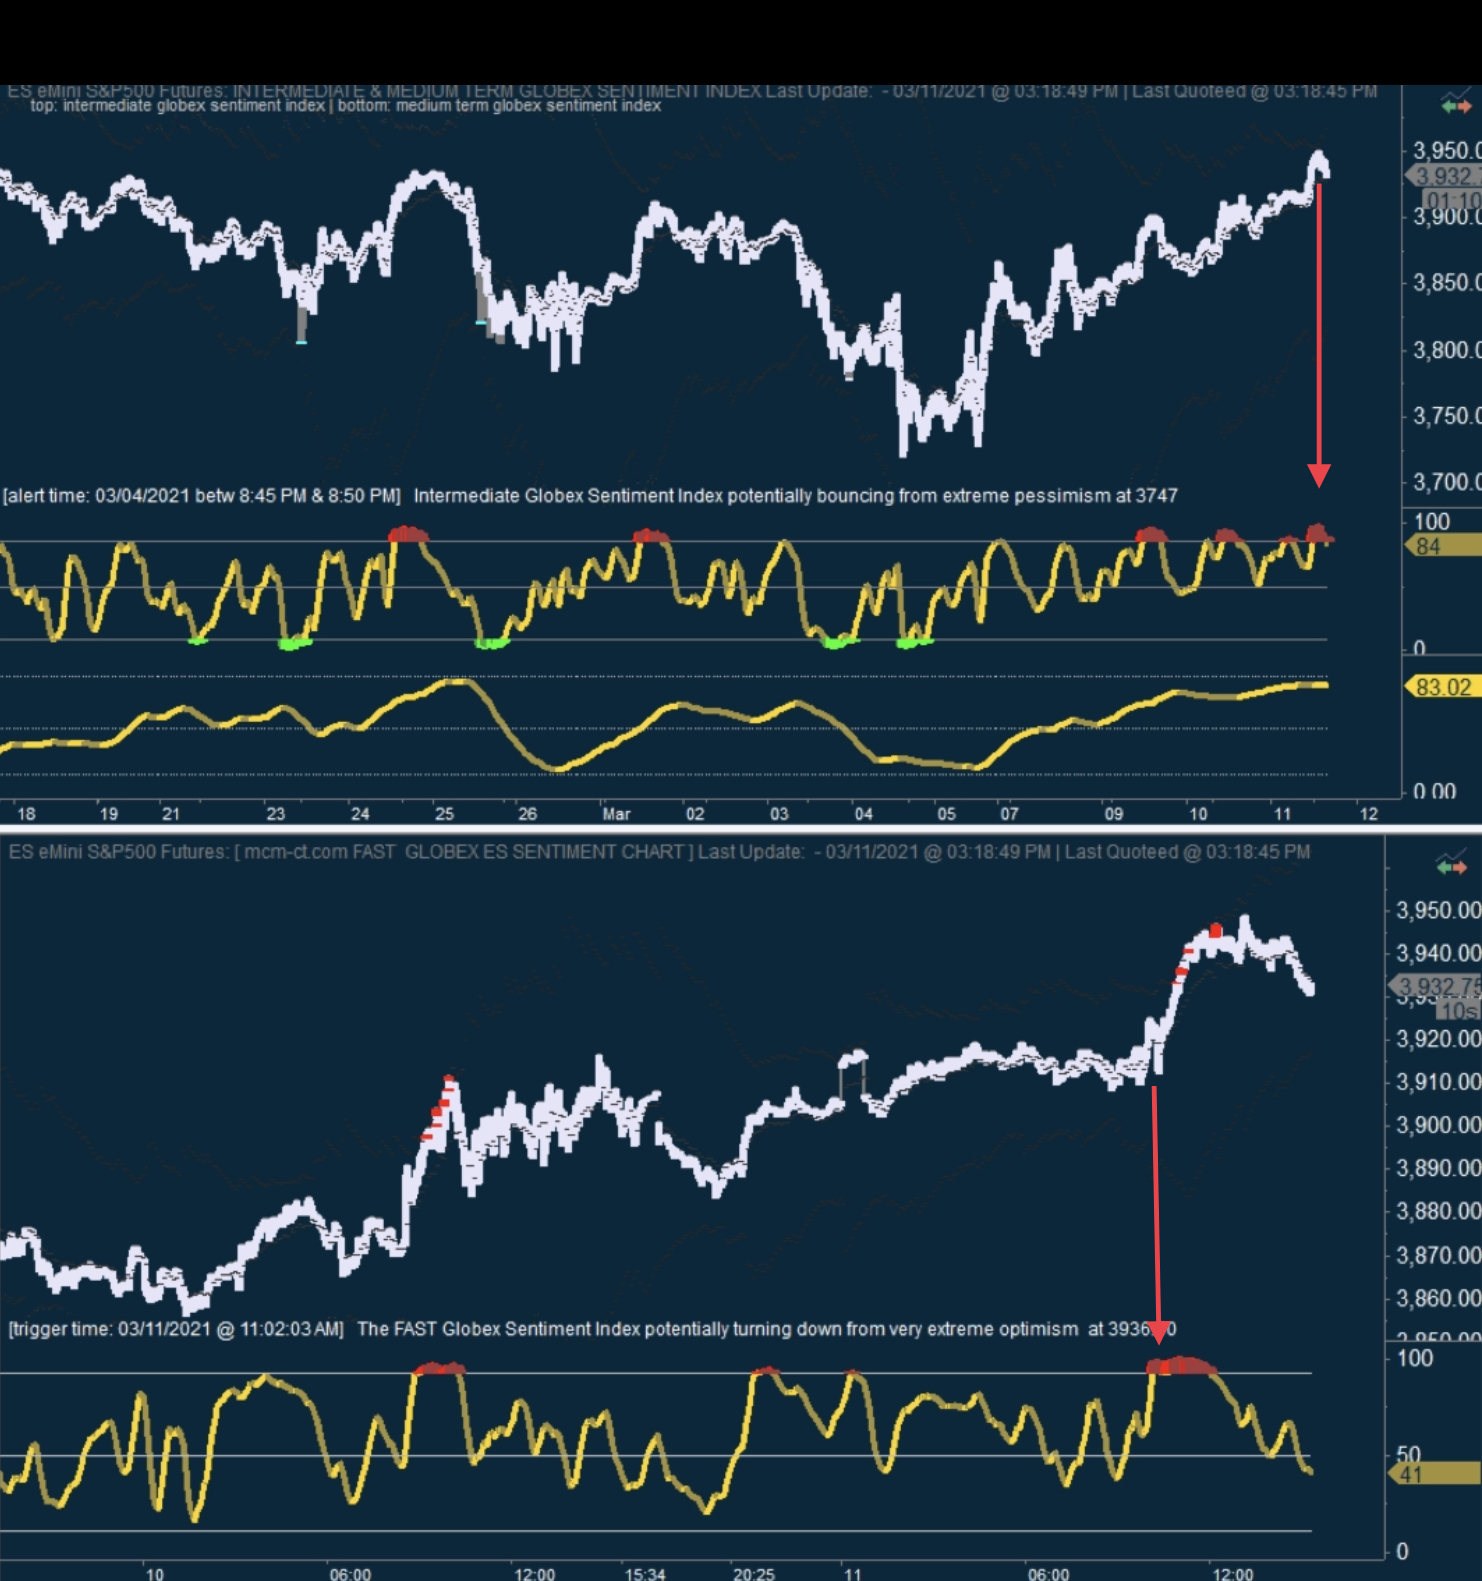
So in conclusion, 1 and 2.5min show that the trend is waning when their cycle strength tool goes lower. Starting to look for short entried on the unwinds of the up impulse (END resistances) on both, is a good strategy. Considering FGSI and IGSI in the red, the odds were high that a pullback was needed before market could continue higher. The profit target can be put close to ML (5 points above ML for example for a portion of it, ML for the majority and a few runners left for ML overshoot).
What happened next we all know, of course. Price came down to ML and even overshot it by about 10 points. Text-book playout for a nice low risk entry.