[image]

Are you ARMED?

Are you DANGEROUS?

Are you ARMED?

Are you DANGEROUS?

Are you ARMED?

mcm-ct provides a real-time analysis tool-set with Charts, Signals, Spoken Alerts via Tick Tools Livestream, Trading Alerts App via Push/SMS/Email, and Market Analysis for professional and individual investors.

Besides the Livestream Members' streaming charts, mcm-ct offers additional sophisticated analysis and tools with enhanced, professional capability for Expert Members on the website. Our tools are timely, accurate, and accessible via iPad, trading workstation, laptop, mobile phone, and internet device. In addition, mcm-ct provides support with market analysis and a live Conversation Room, with a great community to get the most from all members' tools. Through the development of advanced and proprietary data processing, analytics, and technology for markets, mcm-ct seeks to implement intelligent and innovative tools that give an edge in a complex and competitive environment. Connect with Market Emotions.

  • E-TICK TOOLS – High Probability Inflection Points

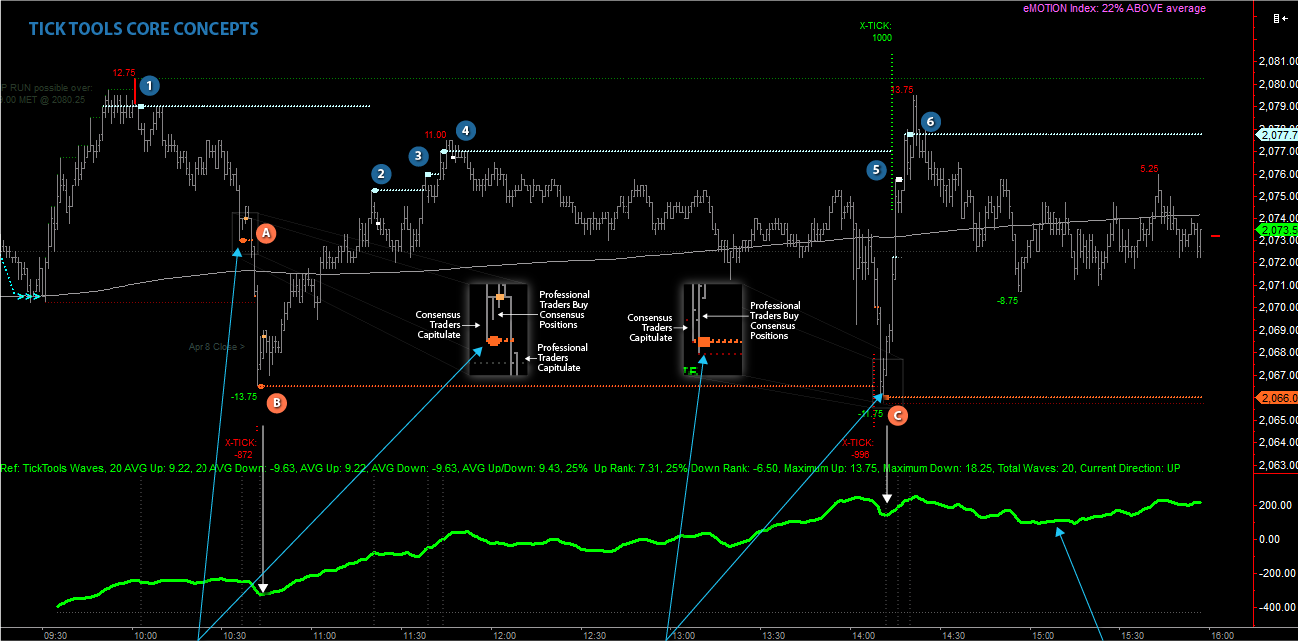
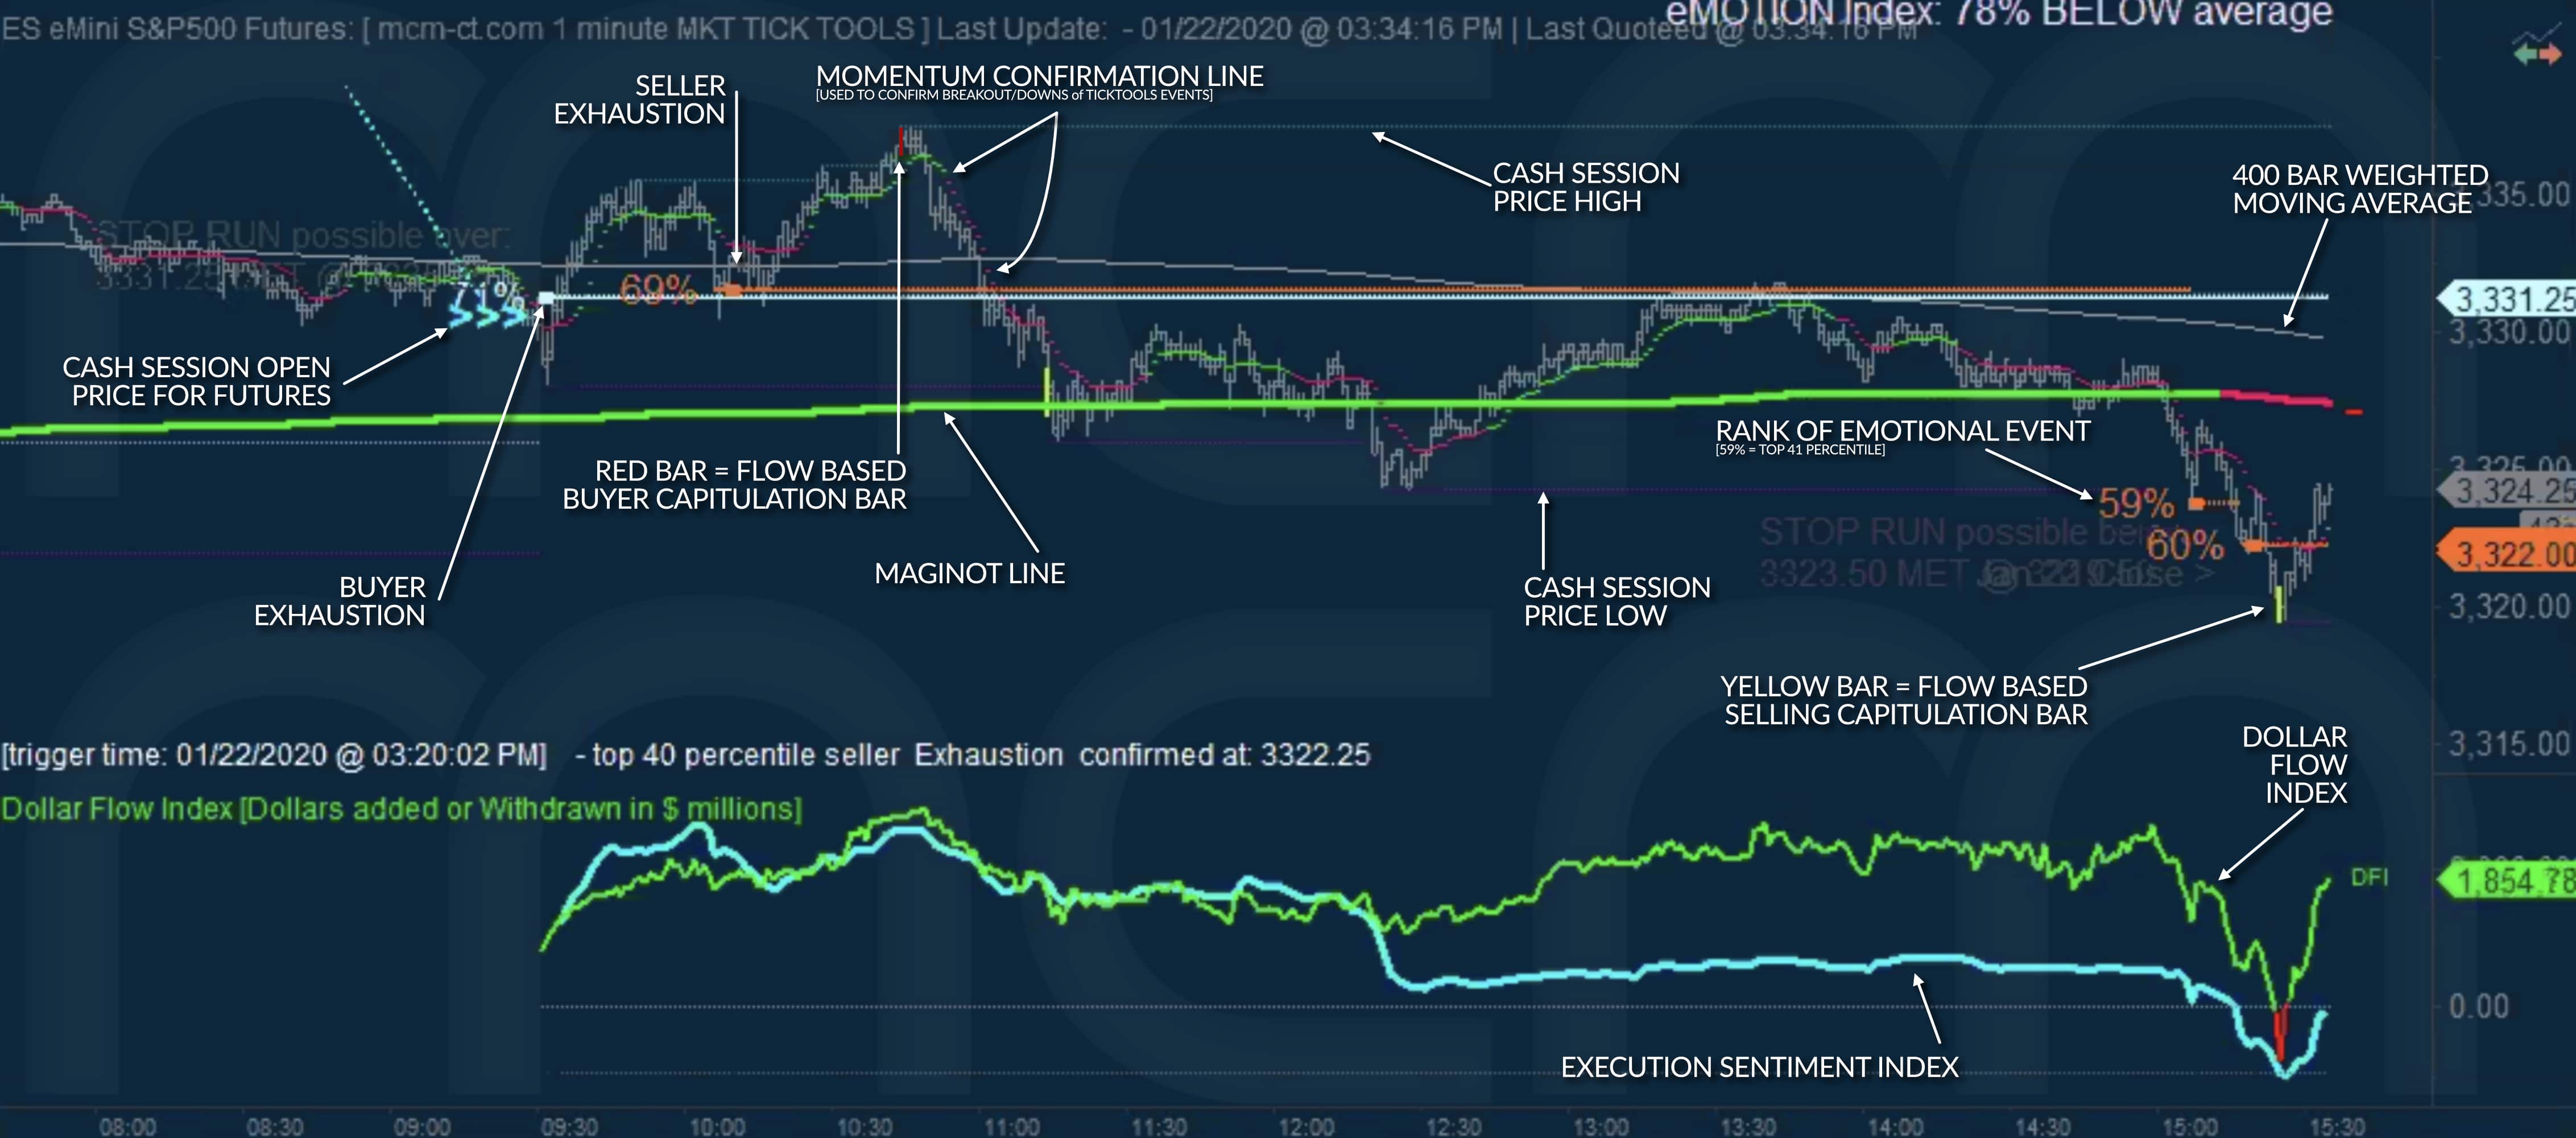
    Our flagship toolset is a technology called e-Tick Tools. The core area of focus of e-Tick Tools technology is: real-time analysis, measurement, ranking, and representation of market participant eMotions behavior, and market impact.

    e-Tick Tools represents a unique proprietary non-correlated, and non-lagging approach to equity index behavioral price analysis. When near high probability inflection points, it produces prescient and quantifiable feedback at operative prices. This capability is achieved based on the trade-level analysis of market participant behavior and exertion levels. e-Tick Tools enables the ability to gain real-time statistically relevant analysis of what traders are doing within markets at extremes. 

    There is NO other toolset we know that reliably establishes a high probability of what market participants are doing. (Read more by clicking on "E-TICK TOOLS")

  • GLOBEX SENTIMENT INDEX - Market Participants Emotion

    The Globex Sentiment Index [GSI] is an excellent tool for showing market participant's pessimism/optimism at any given time. Trading GSI is a high probability actionable tool and greatly enhances using traditional shorter timeframe assessments like trendlines/resistance breakouts/downs and cycles. Additionally, GSI offers a unique structure: Bullish/Bearish Excess Energy emotional imbalances - which are great implications of potential inflection points when most tools don't even know they could be there. (Read more by clicking on "GLOBEX SENTIMENT INDEX")

  • EXECUTION SENTIMENT INDEX - Market Emotions

    The Execution Sentiment Index is a visionary and powerful instrument to gauge what traders are doing, whether the market is being bought or sold. The index includes unique ways of feedback intensity: cash flow into and out of equities on a daily and accumulated basis, share price momentum and directionality, up and down trade ticket executions. (Read more by clicking on "EXECUTION SENTIMENT INDEX")

mcm-Subscriptions
  • CYCLE TOOLS - Market Impulses, Trend Osciallator

    There are quite a few charts that employ the mcm-Cycle toolset. There is a reason: cycles produce impulses similar to an Elliot-wave concept of IMPULSE but more objective and concrete & real-time. They are CYCLIC ENERGY and structural measures (Read more by clicking on "CYCLE TOOLS")

  • LEVELS - Market Support and Resistance

    Support and resistance are critical for assessing markets and making decisions regarding them. mcm-ct uses an innovative technological way to build the REAL support and resistance levels the market has created. 1- and 5-minute charts build a database of every inflection point, evaluate their importance, and provide dynamic feedback and access to this most critical data. (Read more by clicking on "LEVELS")

  • GAP TOOLS - Analyzing First Minute Of Trading

    GAP TOOLS offers real-time analysis of gap scenarios, including emotion, volume, strength, and velocity to create gap projection probabilities computed within the first minute of the cash sessionUnderstanding the percentile ranking of a gap emotion is a powerful tool. It shows remarkable prescience about volume, dollars added, dollars withdrawn, and range of outcome probabilities very early in the session. Time frames for the high of the day, low of the day, break-down, reversal, and fill possibilities are significant inputs in understanding the most likely behavior for a gap as it occurs.  (Read more by clicking on "GAP TOOLS")

Please note that all the data provided should not be relied upon for settlement or other purposes. mcm-ct makes no representations or warranties regarding the accuracy and timeliness of the data provided and shall not be responsible for any parties’ reliance on any such data or conclusions drawn by using it.