

Core Concepts
Explore e-Tick Tools Details
What makes its Capabilities
& Approach unique/powerful

Buy/Sell Exhaustions
Access when conditions
are setup and likely to
trigger Stop Runs

Detailed Analysis
A day of emotional & volume
feedback for S&P500 Futures
using e-Tick Tools

Testimonials
Our members experience
with e-Tick Tools real-time
emotion analysis

Chart Book
e-Tick Tools & Expert Mem-
bership Chart Examples
(reference)
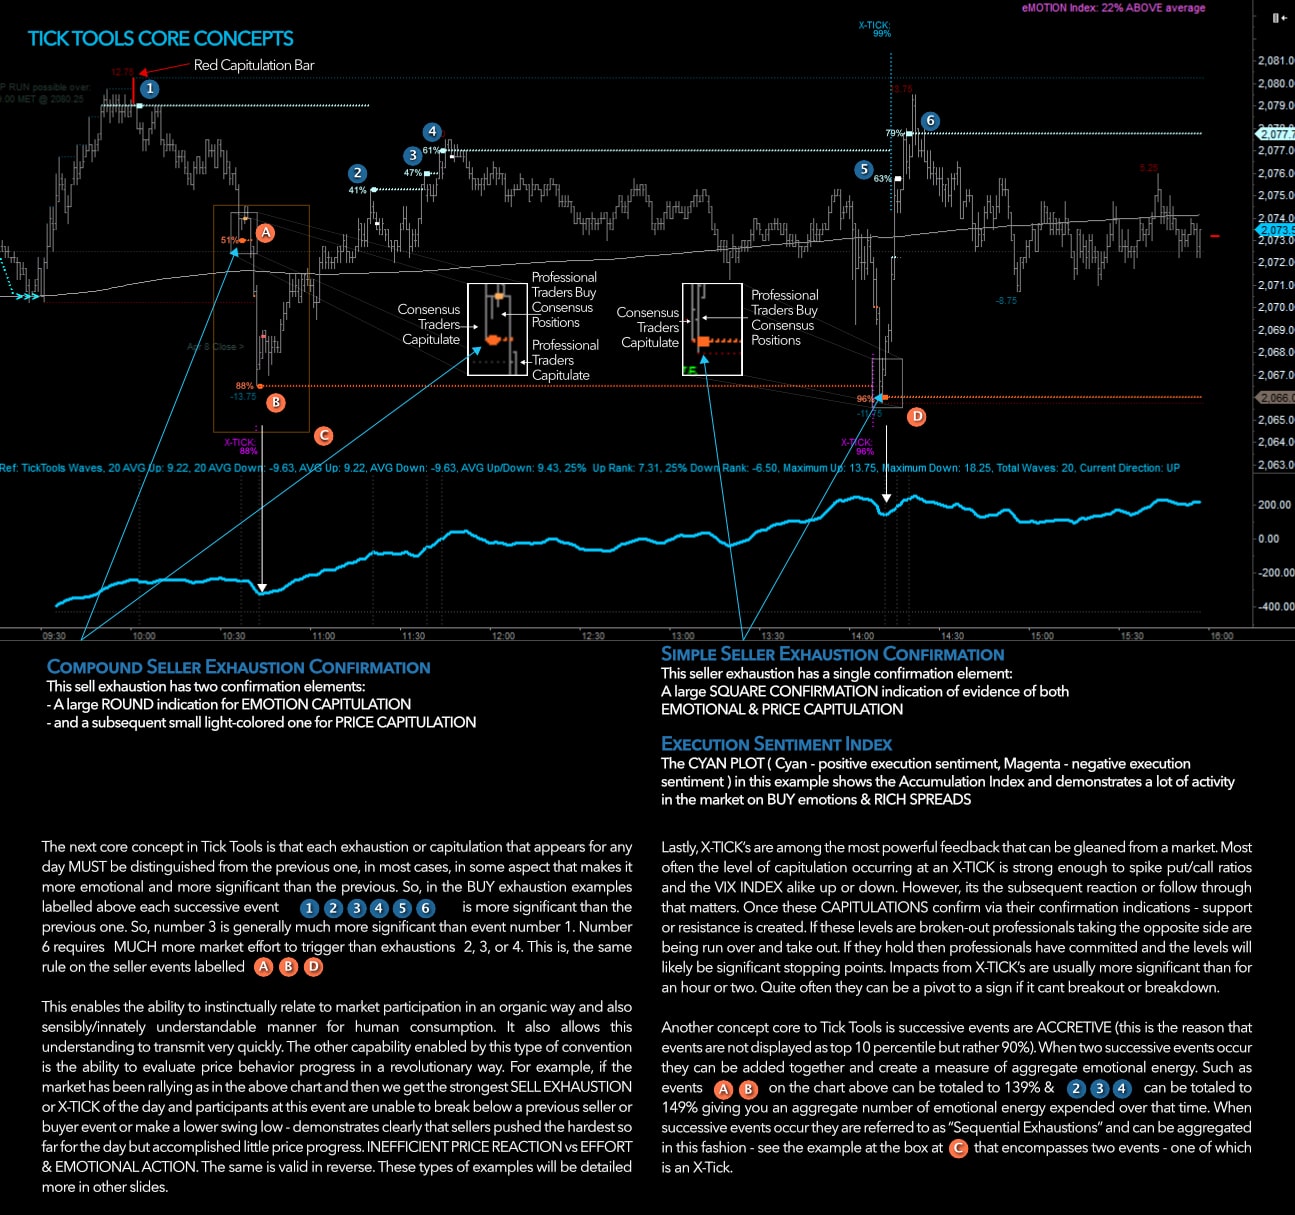
E-TICK TOOLS – Core Concepts
One of the most powerful elements of e-Tick Tools is its ability to speak fairly concretely about the nature of behavioral market events and their character. Lets examine what is transpiring at a seller and buyer exhaustion. What is occurring at all e-Tick Tools exhaustion’s is a form of CAPITULATION. It can be fast or slow. It can be on small volume or large volume. WHAT IS CAPITULATION?
The e-Tick Tools Definition of Capitulation is:
Disorderly market executions containing chaotic “unmanaged position closing” or “position flipping” via market orders.
This can be further defined:
Events of market stress that are resolved via an unusually high number of Manual Market Orders or Stop Market Orders at an unusual velocity combined with diffuse/low-quality price executions (high realized spreads for buyers vs sellers) on both sides of the order book.
What is transpiring at a Sell and Buy Exhaustion, and why they can be so important? Why this feedback can tell us something about the light switches in the markets that often flip sentiment at specific prices and places?
Occasionally, traders can identify with some confidence when Capitulation in the markets may be occurring but rarely with consistency, accuracy, and perspective. e-Tick Tools activates this capability on an unprecedented and dynamic scale.
e-Tick Tools watches the market for this kind of activity and cross-references each metric that defines capitulation with its database indexes of extreme trader behavior on any of those metrics. When a sufficient amount of capitulatory behavior is approached, e-Tick Tools begins tracking the prices of the most significant capitulatory events. This is when the price-tracking indication will appear. Subsequently, when a market starts to revert to an orderly execution environment, capitulation is deemed complete and is one of several types of CONFIRMATION indication displays - a unique and powerful core capability of e-Tick Tools. There is no other tool that we know of that analyzes trade ticket activity in real-time.
If we now understand that each of the e-Tick Tools Buy or Sell Exhaustion are capitulatory - we know a lot about the traders executing trades at these points. We can watch for subsequent key behavior from the various classes of traders. Professional traders (a level of trader we focus on in) prefer to operate when the market becomes disorderly. Therefore, they prefer to short highs where the consensus market participants (another class of trader in our focus) elect to stop out of short risk. Additionally, they also prefer to buy lows where the consensus trader is reducing or close long risk. e-Tick Tools draws lines in the sand (Price Tracking & Exhaustion/Capitulatory events). As professionals act at these capitulatory locations, the prices will become Support or Resistance and likely be defended. If price tracking levels break in a significant manner, then it is a definite clue that the most skilled traders are vacating or being even forcibly expelled from their positions. At these points, capitulation events may be deemed to have been part of a more considerable directional momentum.
One of the most powerful concepts implemented by e-Tick Tools to view this data is the stratification of ways to represent the measurement of it: Normal capitulation and X-Treme Capitulation. The difference between Normal capitulation is not very significant for the user though this distinction is imperative for e-Tick Tools.
Normal capitulation can be emotional market behavior that ranks in the top 70 percentile of extreme aberration and capitulatory behavior. For X-Ticks (X-Treme Capitulation), this must score in the top 12% percentile of all emotional action in the markets in the last 20+ years in the e-Tick Tools Database. These are remarkably valuable data analysis that is not price dependent or reactive to latent analysis. This analysis occurs instantly.